
Beyond the Bank Balance: Why Healthcare Practices Need Cash Flow Forecasts
- Published
- Nov 2, 2026
- Share
Key Takeaways
- Estimating cash by instinct works for a young practice, but a growing practice needs a model built on its own history.
- A ten-week cash flow projection shows inflows, outflows, and the lowest point your cash reaches before it recovers.
- Payroll and accounts payable typically drive the rhythm of cash, so timing in those two categories matters more than any single expense.
- A projection helps you decide whether to hold, invest, or distribute cash, and it flags problems while you still have time to act.
- The projection only stays useful if you refresh it regularly with actual results.
Are You Managing Cash by Instinct?
Many healthcare practice owners manage cash by feel. They check the bank balance, recall what came in last month, and make a reasonable guess about what comes next. When a practice is small and resources are limited, back-of-the-napkin math can be all that’s practical.
Growth raises the stakes. A larger staff, a longer list of payer contracts, and a heavier payroll turn a wrong guess into a real problem. A cash flow projection replaces the guess with a model built on where your cash has been.
This article explains what a projection shows, walks through an illustrative example, and outlines the decisions it supports.
The Questions a Projection Answers
A well-built projection gives you specific answers to questions many owners can only estimate:
- What are your average weekly inflows and outflows?
- What is the spread between the two?
- What share of your outflows goes to payroll, and what share goes to accounts payable (AP)?
- How many weeks of cash buffer do you hold?
- What happens if collections slow down?
- Is there room for an owner distribution or bonus, and when?
Each answer moves you from reacting to cash events toward planning for them.
What a Ten-Week Projection Looks Like
To show how this works, we built a sample report for a fictional organization.
The model starts with $361,000 in available cash. We define available cash as the primary operating account plus the payroll account, and we exclude reserve and clearing accounts. That definition matters because it keeps money you can’t spend this week out of the picture.
As the chart below shows, available cash dips to $338,000 in the first forecast week, then climbs to $532,000 by the end of week ten. That is a gain of $171,000.
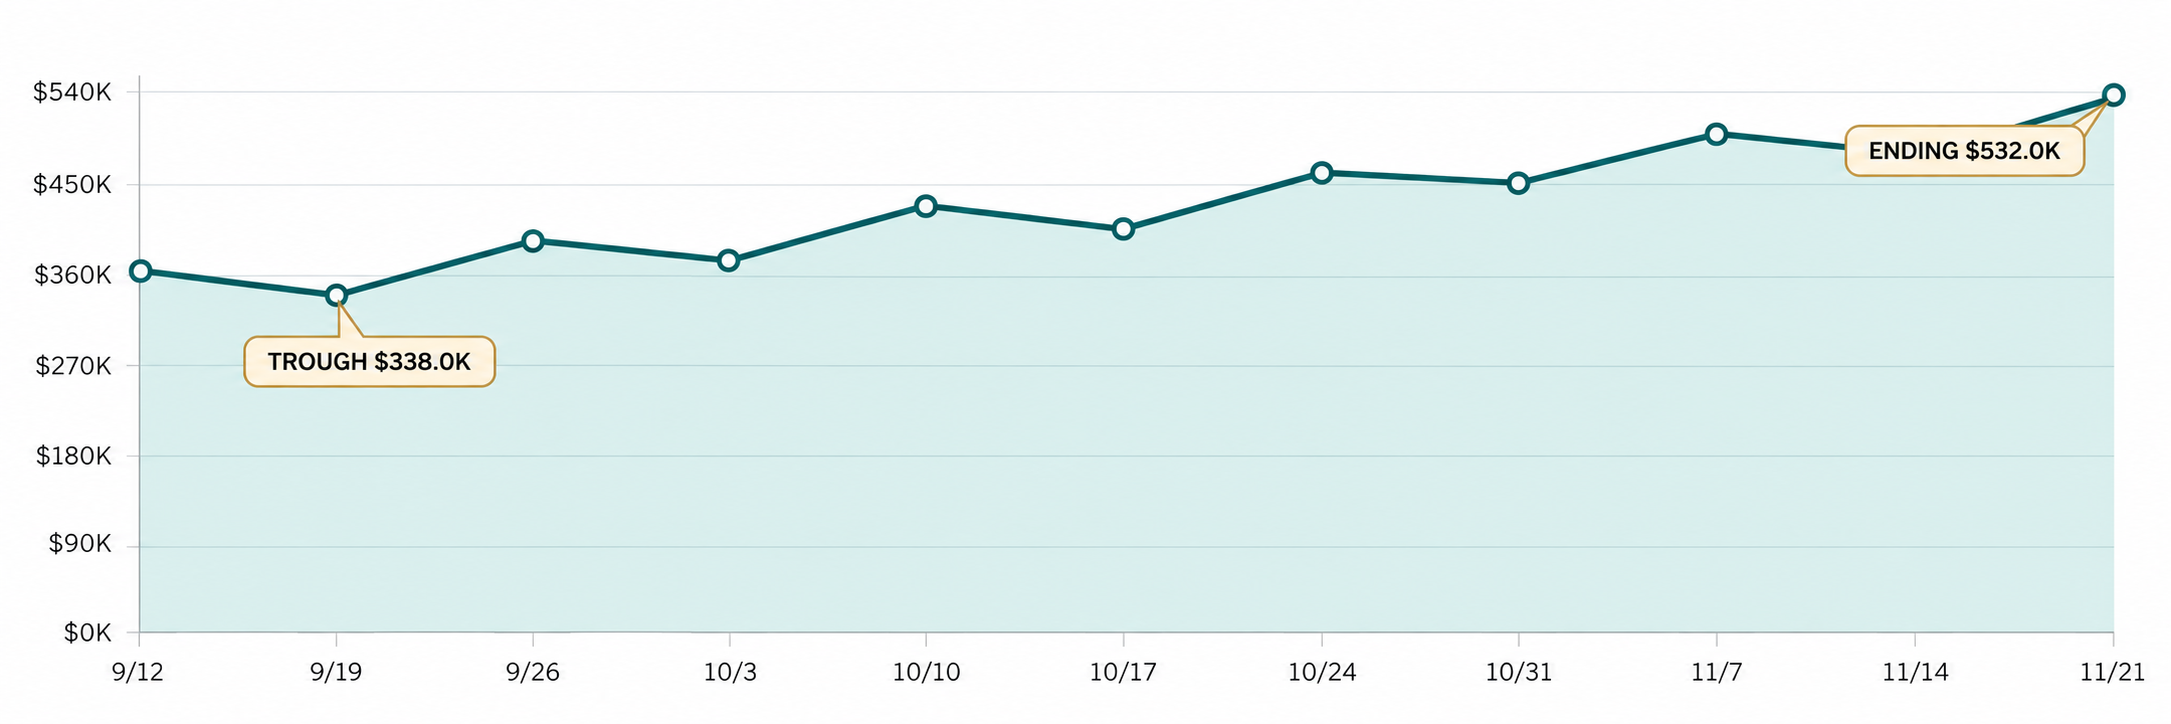
Illustrative sample: weekly ending available cash over a ten-week forecast.
Average weekly receipts of $105,000 outpace average weekly outflows of $87,900, and that $87,900 figure doubles as a one-week operating buffer. The lowest balance is 3.8 times that buffer, and no week falls below it.
Payroll Sets the Rhythm
The weekly view tells a more useful story than the totals. Payroll and retirement contributions land every other week, so outflows alternate between light and heavy weeks. Three of those heavy weeks, when other payments land at the same time, reach $128,000 in outflows.
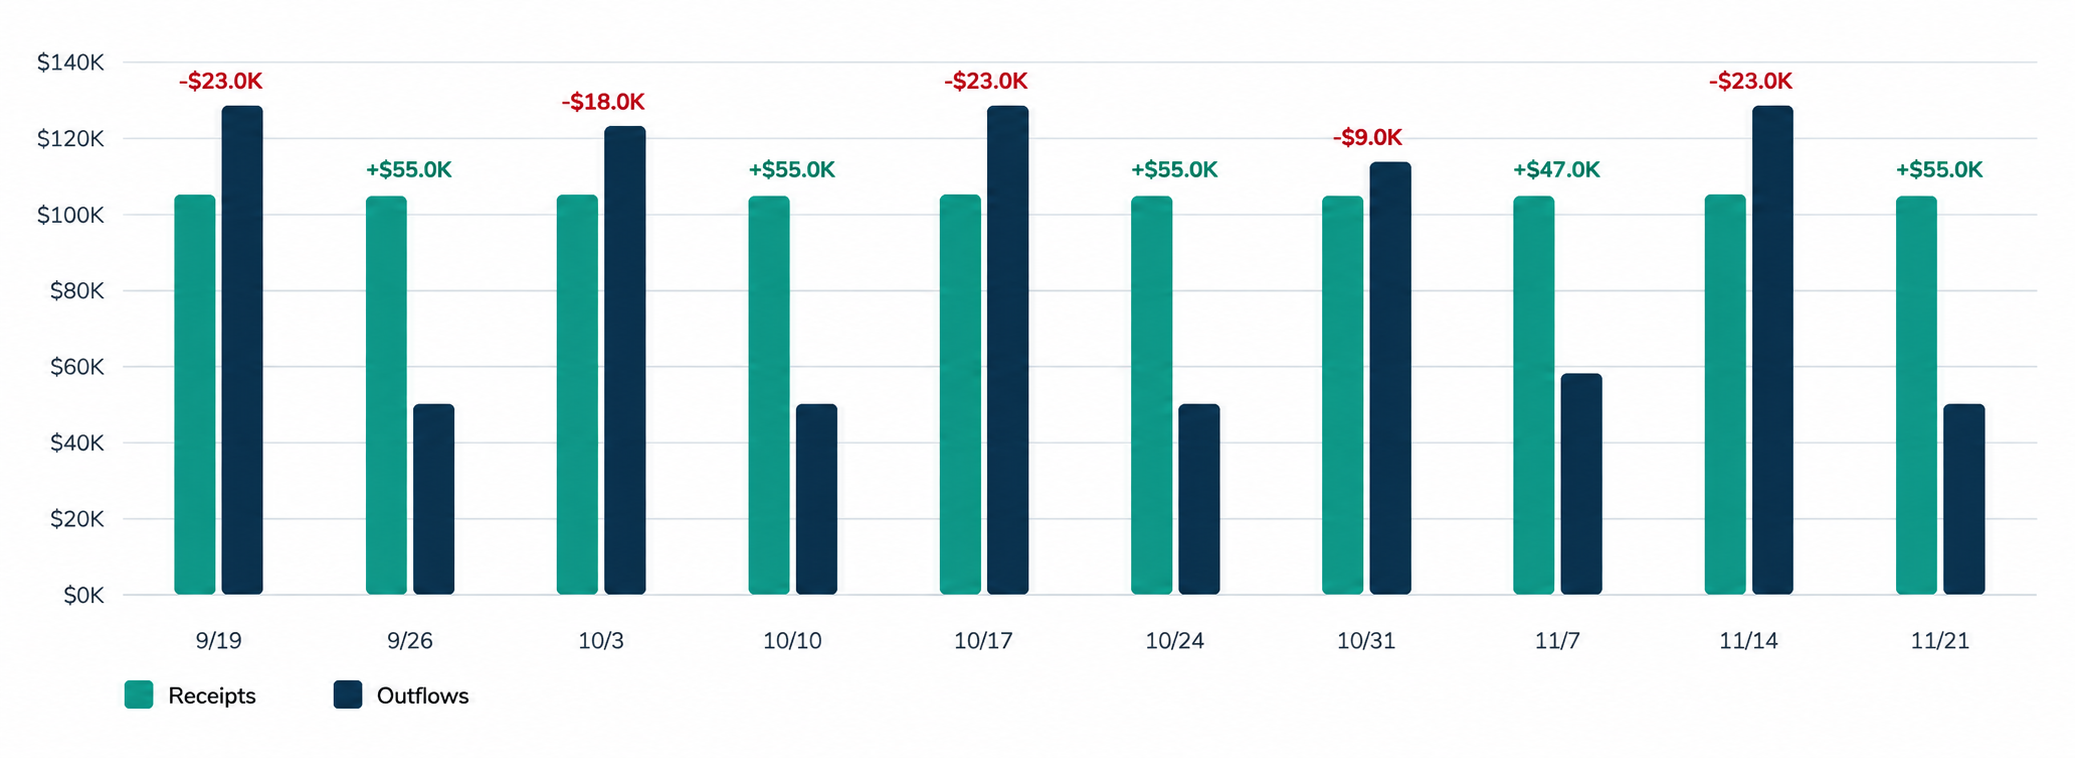
Illustrative sample: weekly receipts versus outflows. The figure above each pair is the net change in cash for that week.
Every week with a payroll run shows a net outflow, and every other week adds cash. The outflow mix explains why. Payroll and retirement account for 63.7% of forecast outflows, and AP accounts for 29.6%. Together, those two categories represent 93.3% of all cash going out. Rent, credit cards, and auto and interest payments make up the remaining 6.7%.
For most owners, that is the practical insight: You don’t need to watch every expense equally. You need to manage the timing of payroll and AP.
Why This Matters for Healthcare Practices
Payroll is a large share of the cost structure in most practices, and collections depend on when payers and patients pay, not when you deliver care. A projection lets you see how those two timelines interact. Strong revenue cycle management can narrow the gap between the two, and the projection shows you how much that gap matters in any given week.
The sample models this with a simple test. If one weekly receipt of $105,000 slips beyond the ten-week window, ending cash falls to $427,000. That is still $339,100 above the buffer. A practice with thinner margins or slower collections would see a very different answer, and would want to know that before the delay happens.
Decisions a Projection Supports
Once you can see where cash is going, several decisions become easier:
- Hold or invest. If you carry a large bcash buffer, you may earn more interest by moving part of it out of a low-yield account.
- Distribute with confidence. If headroom is consistently high, you may be able to take a larger owner distribution, or take one more often.
- Protect peak weeks. In the sample, keeping at least $128,000 in liquid funds ahead of each heavy payroll week guards against a shortfall.
- Time AP carefully. You can review the timing of noncritical payments during peak payroll weeks without disrupting essential vendors.
- Set a warning trigger. In the sample, weekly receipts trending below $87,900, the average cash requirement, would prompt a closer look.
Keep the Projection Current
A projection is a living document. Regularly replace projected amounts with actual results and roll the forecast forward. That routine keeps the lowest point and any delayed-receipt risk visible, so you catch a trend while it is still small.
The same discipline applies to the financial KPIs your practice already tracks. Organizations that want a longer view can also read about the power of the 13-week cash flow forecast.
Take the Next Step
EisnerAmper builds customized cash flow projections that show where your cash is headed, based on where it has been. If you would like to see how a projection could work for your practice, learn more about our healthcare cloud accounting and outsourcing services, or contact our team using the form.
What's on Your Mind?

Ryan DeDonato
Ryan DeDonato is a Manager in the Outsourced Services Group. With nearly 10 years of experience, he supports healthcare clients with financial reporting, process improvement, and strategic accounting to drive efficiency and business growth.
Start a conversation with Ryan


