Best Practices for Teams in Data Analytics and Business Intelligence
- Published
- Jun 1, 2023
- Share
Part I: Top Three Best Practices for Effective Data Visualizations
When it comes to making any crucial decision, it always comes down to the data. But how this data is presented can make as much of an impact in the decision as the data itself. That’s where data visualization comes in.
According to IBM: “Data visualization is the representation of data through use of common graphics, such as charts, plots, infographics, and even animations. These visual displays of information communicate complex data relationships and data-driven insights in a way that is easy to understand.”
If it's done right, your visualizations will seamlessly drive your points home to your audience. On the other hand, if your visuals leave the audience straining to understand what they’re looking at, they can miss your point altogether. With some guiding principles, you can greatly increase the odds that your ideas will hit their mark.
Simplicity in Data Visualization
Aim to keep the visual displays as simple as possible. Remember, you want to capture your audience’s attention; however, you don’t want to overload them and lose them as a result. Ideally, your visuals should tell them everything they need to know at first glance. There is a balance between too much information and too little. In my opinion, however, it’s best to err on the side of simplicity. If you feel you need more accompanying visuals to drive your points home, you can always provide a second level of detail to drill down to. In short, start off brief and expand from there.
Know Your Audience
Before creating your visuals, have a good idea of who you will be presenting your thoughts to. You want to align your visuals to the needs of your audience. For example, does your audience have a lot of technical expertise? What types of decisions does your audience make? What information does your audience need to make these decisions? The types of visuals for one group of people may not be appropriate for others. For example, if you are presenting to an audience of executives, you may choose to design your visuals so they can be easily exported in one page as an email attachment or included in a report. Knowing who this audience is will help you make the most impact.
Take Advantage of Pre-Attentive Attributes
Finally, take advantage of what is referred to as pre-attentive attributes. When you first glance at a visual, these are the features that our brains are hard-wired to notice above all else. Subconsciously, our brains have an order of operations when it comes to processing visual stimuli. For example, text in a bright font will immediately jump out at the viewer, and their eyes will naturally be drawn to that part of the visual. Going back to the principle of simplicity, you can utilize pre-attentive features to highlight the most crucial elements of your story quickly and easily to your audience. The key is to show your audience everything they need to know in the way that requires the least amount of effort on their part as possible.
Growing in a Data and Business Intelligence Maturity Model
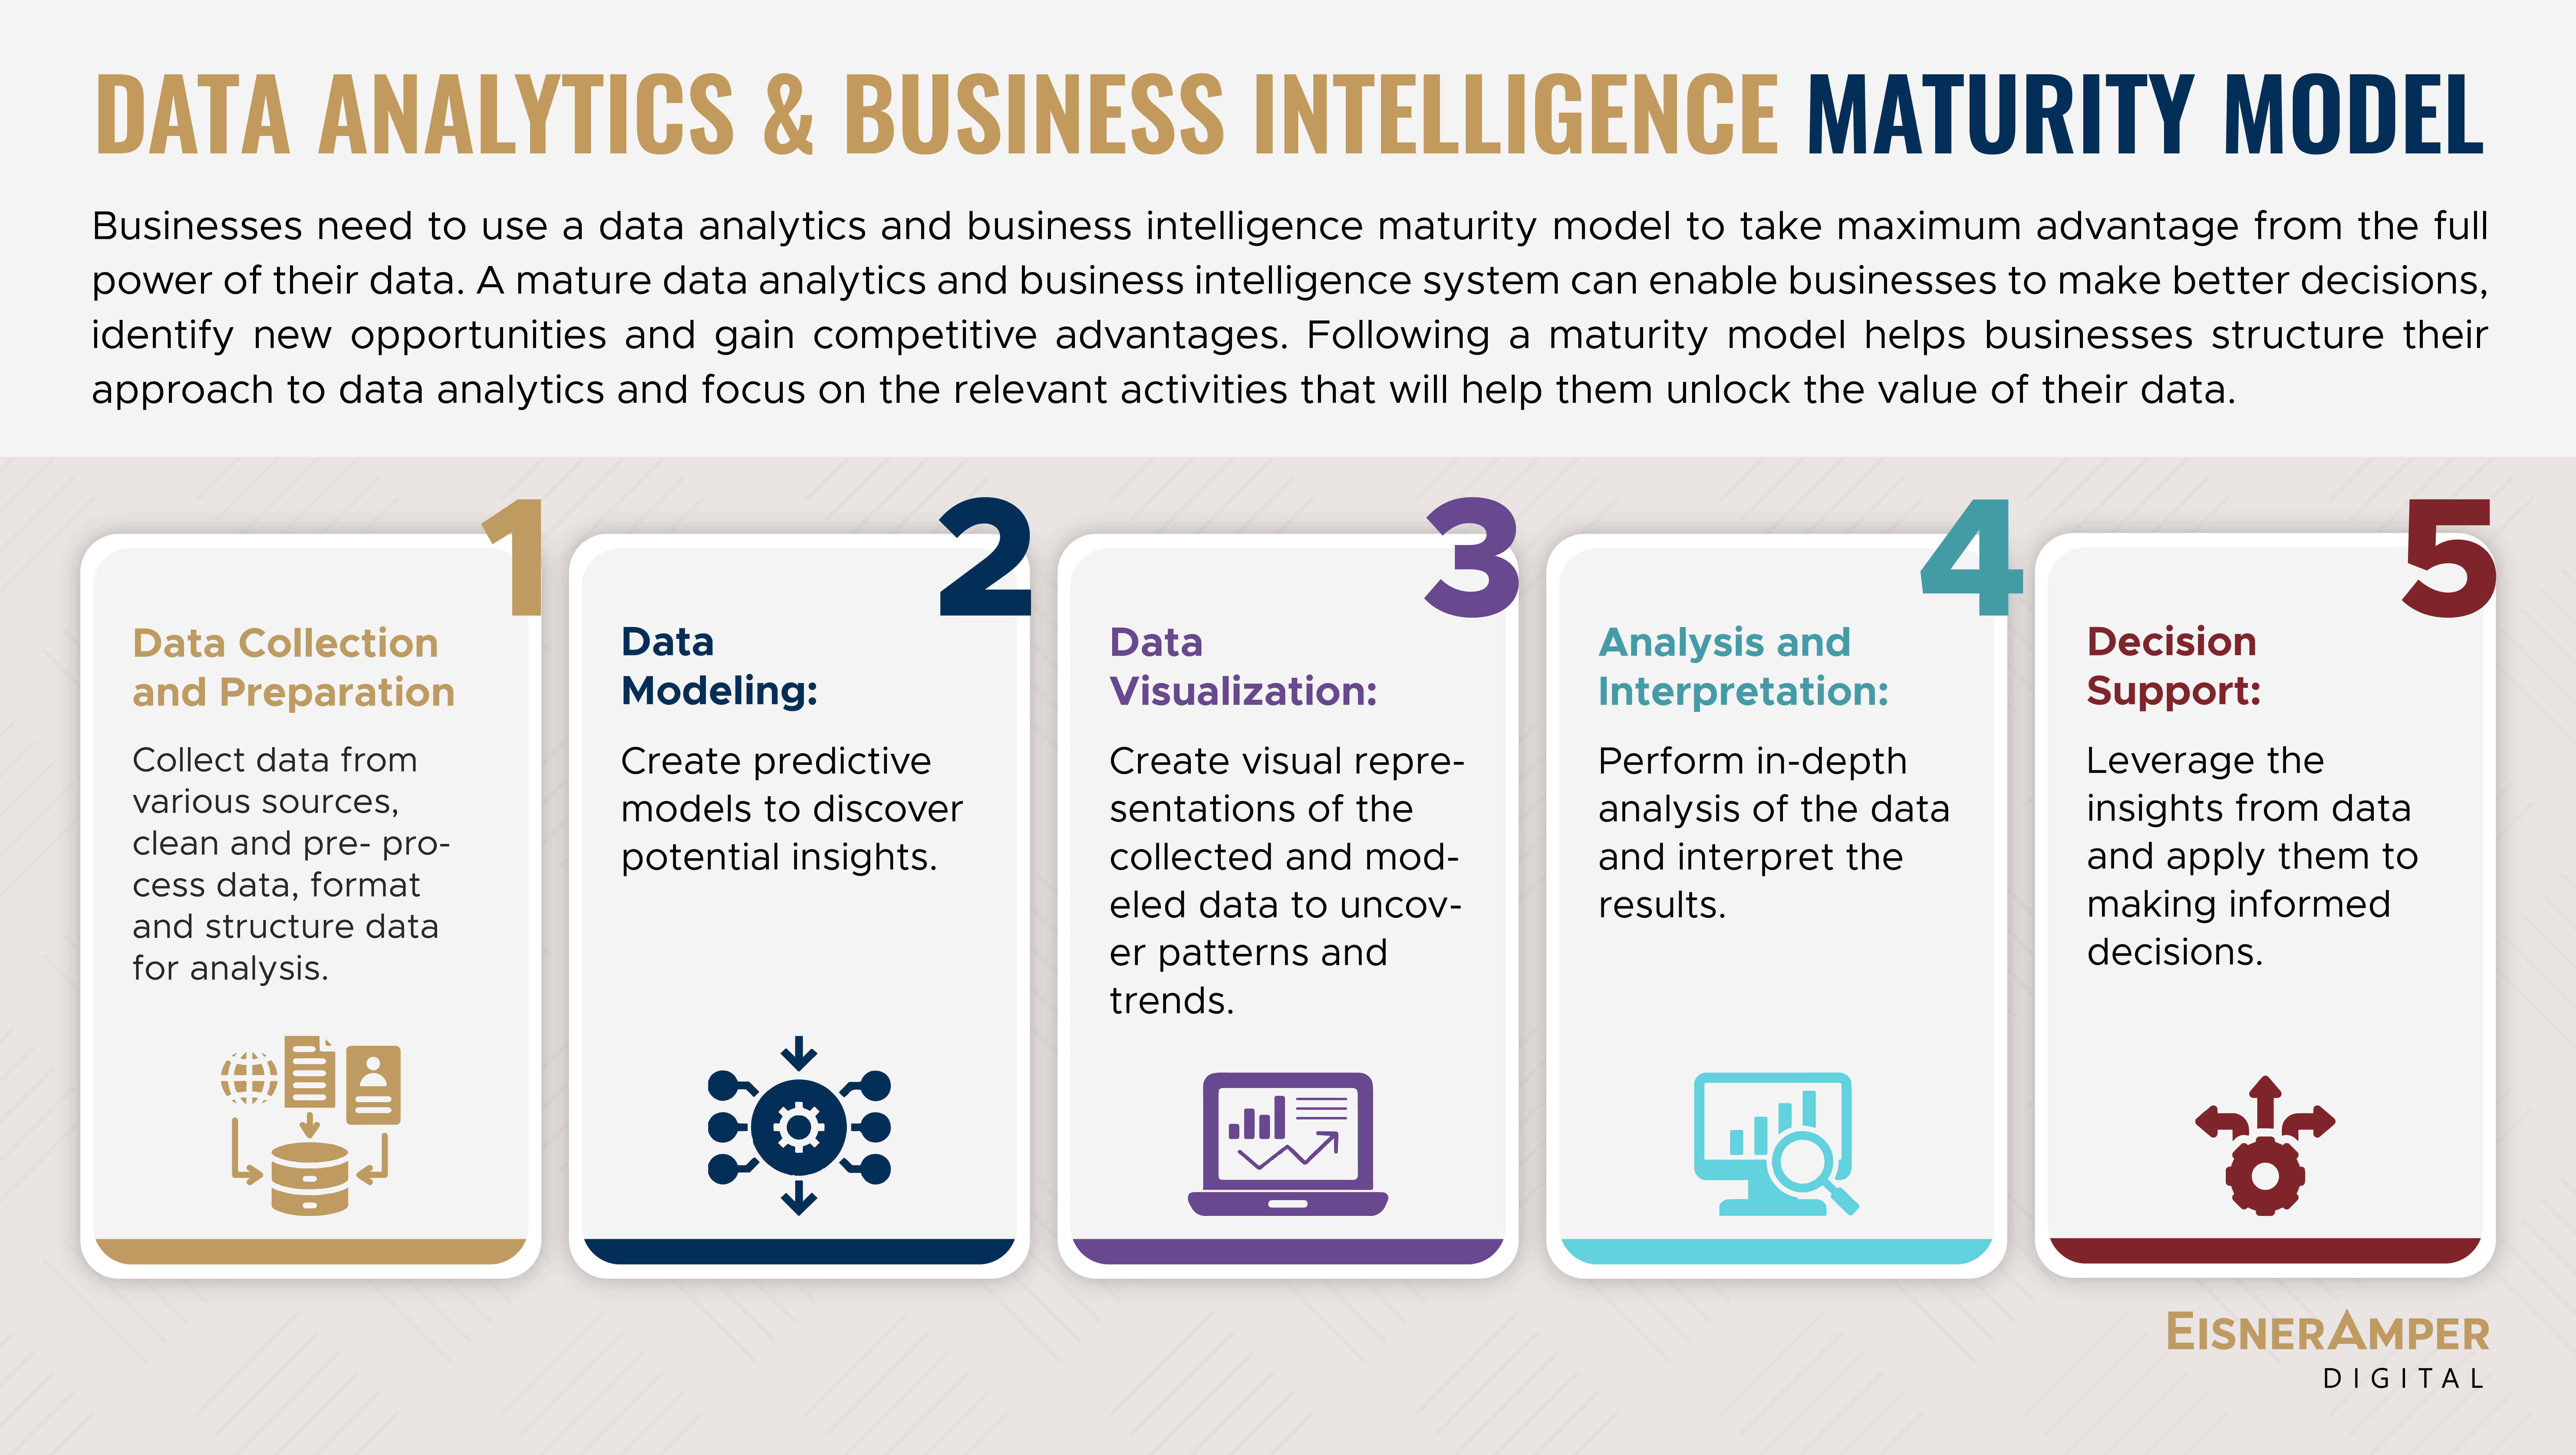
Consider using a maturity model to develop your data and business intelligence skills.This model enables organizations to assess their present data use level, identify areas for improvement and define a growth path. Organizations can improve their data-driven decision-making, streamline processes, and maximize the value generated from their data assets by evolving through different maturity levels. Implementing a data and business intelligence maturity model enables firms to establish effective governance frameworks, foster a data-driven culture, and continuously evolve their analytical skills.

Final Thoughts
To realize the full potential of data visualization, a thoughtful approach that promotes both simplicity and audience engagement is required. By following these best practices, you can speed up the visualization design process and guarantee that your audience gets the most out of the data provided.
Consider harnessing the experience of a trusted advisory service in data analytics and business intelligence before embarking on a data-driven journey toward organizational insights. Their advice will enable you to establish strong data analytics strategies and take control of decision-making, resulting in faster and more impactful outcomes.
We will continue to look into other best practices geared specifically for teams that deal with data analytics and business intelligence in subsequent publications in this series. Stay tuned for an in-depth examination of these issues as we work to provide you with useful insights to fuel your data-driven initiatives.
What's on Your Mind?
Start a conversation with Alex
Receive the latest business insights, analysis, and perspectives from EisnerAmper professionals.


